Active Travel Network Plan Supporting Data

The Network Plan and prioritised routes have been informed by data including, demographics, indices of multiple deprivation, health, car ownership, how people travel to work, propensity to cycle, the Cumbria Visitor Survey and Strava Metro.

Population and Demographics

The population of the Lake District National Park (LDNP) is declining, particularly the proportion of the population who are working age (those aged 15 to 64). Between 2011 and 2021, the total population of the LDNP has declined by 4.5% from 40,770 in 2011 to 38,992 in 2021 (Office for National Statistics, 2021).

Between 2011 and 2021, the proportion of the Lake District’s population aged 65+ years increased by 3.9%, those aged over 65 now represent 24.3% of Cumbria’s total population in comparison to over 65’s representing 18.4% of England’s total population.

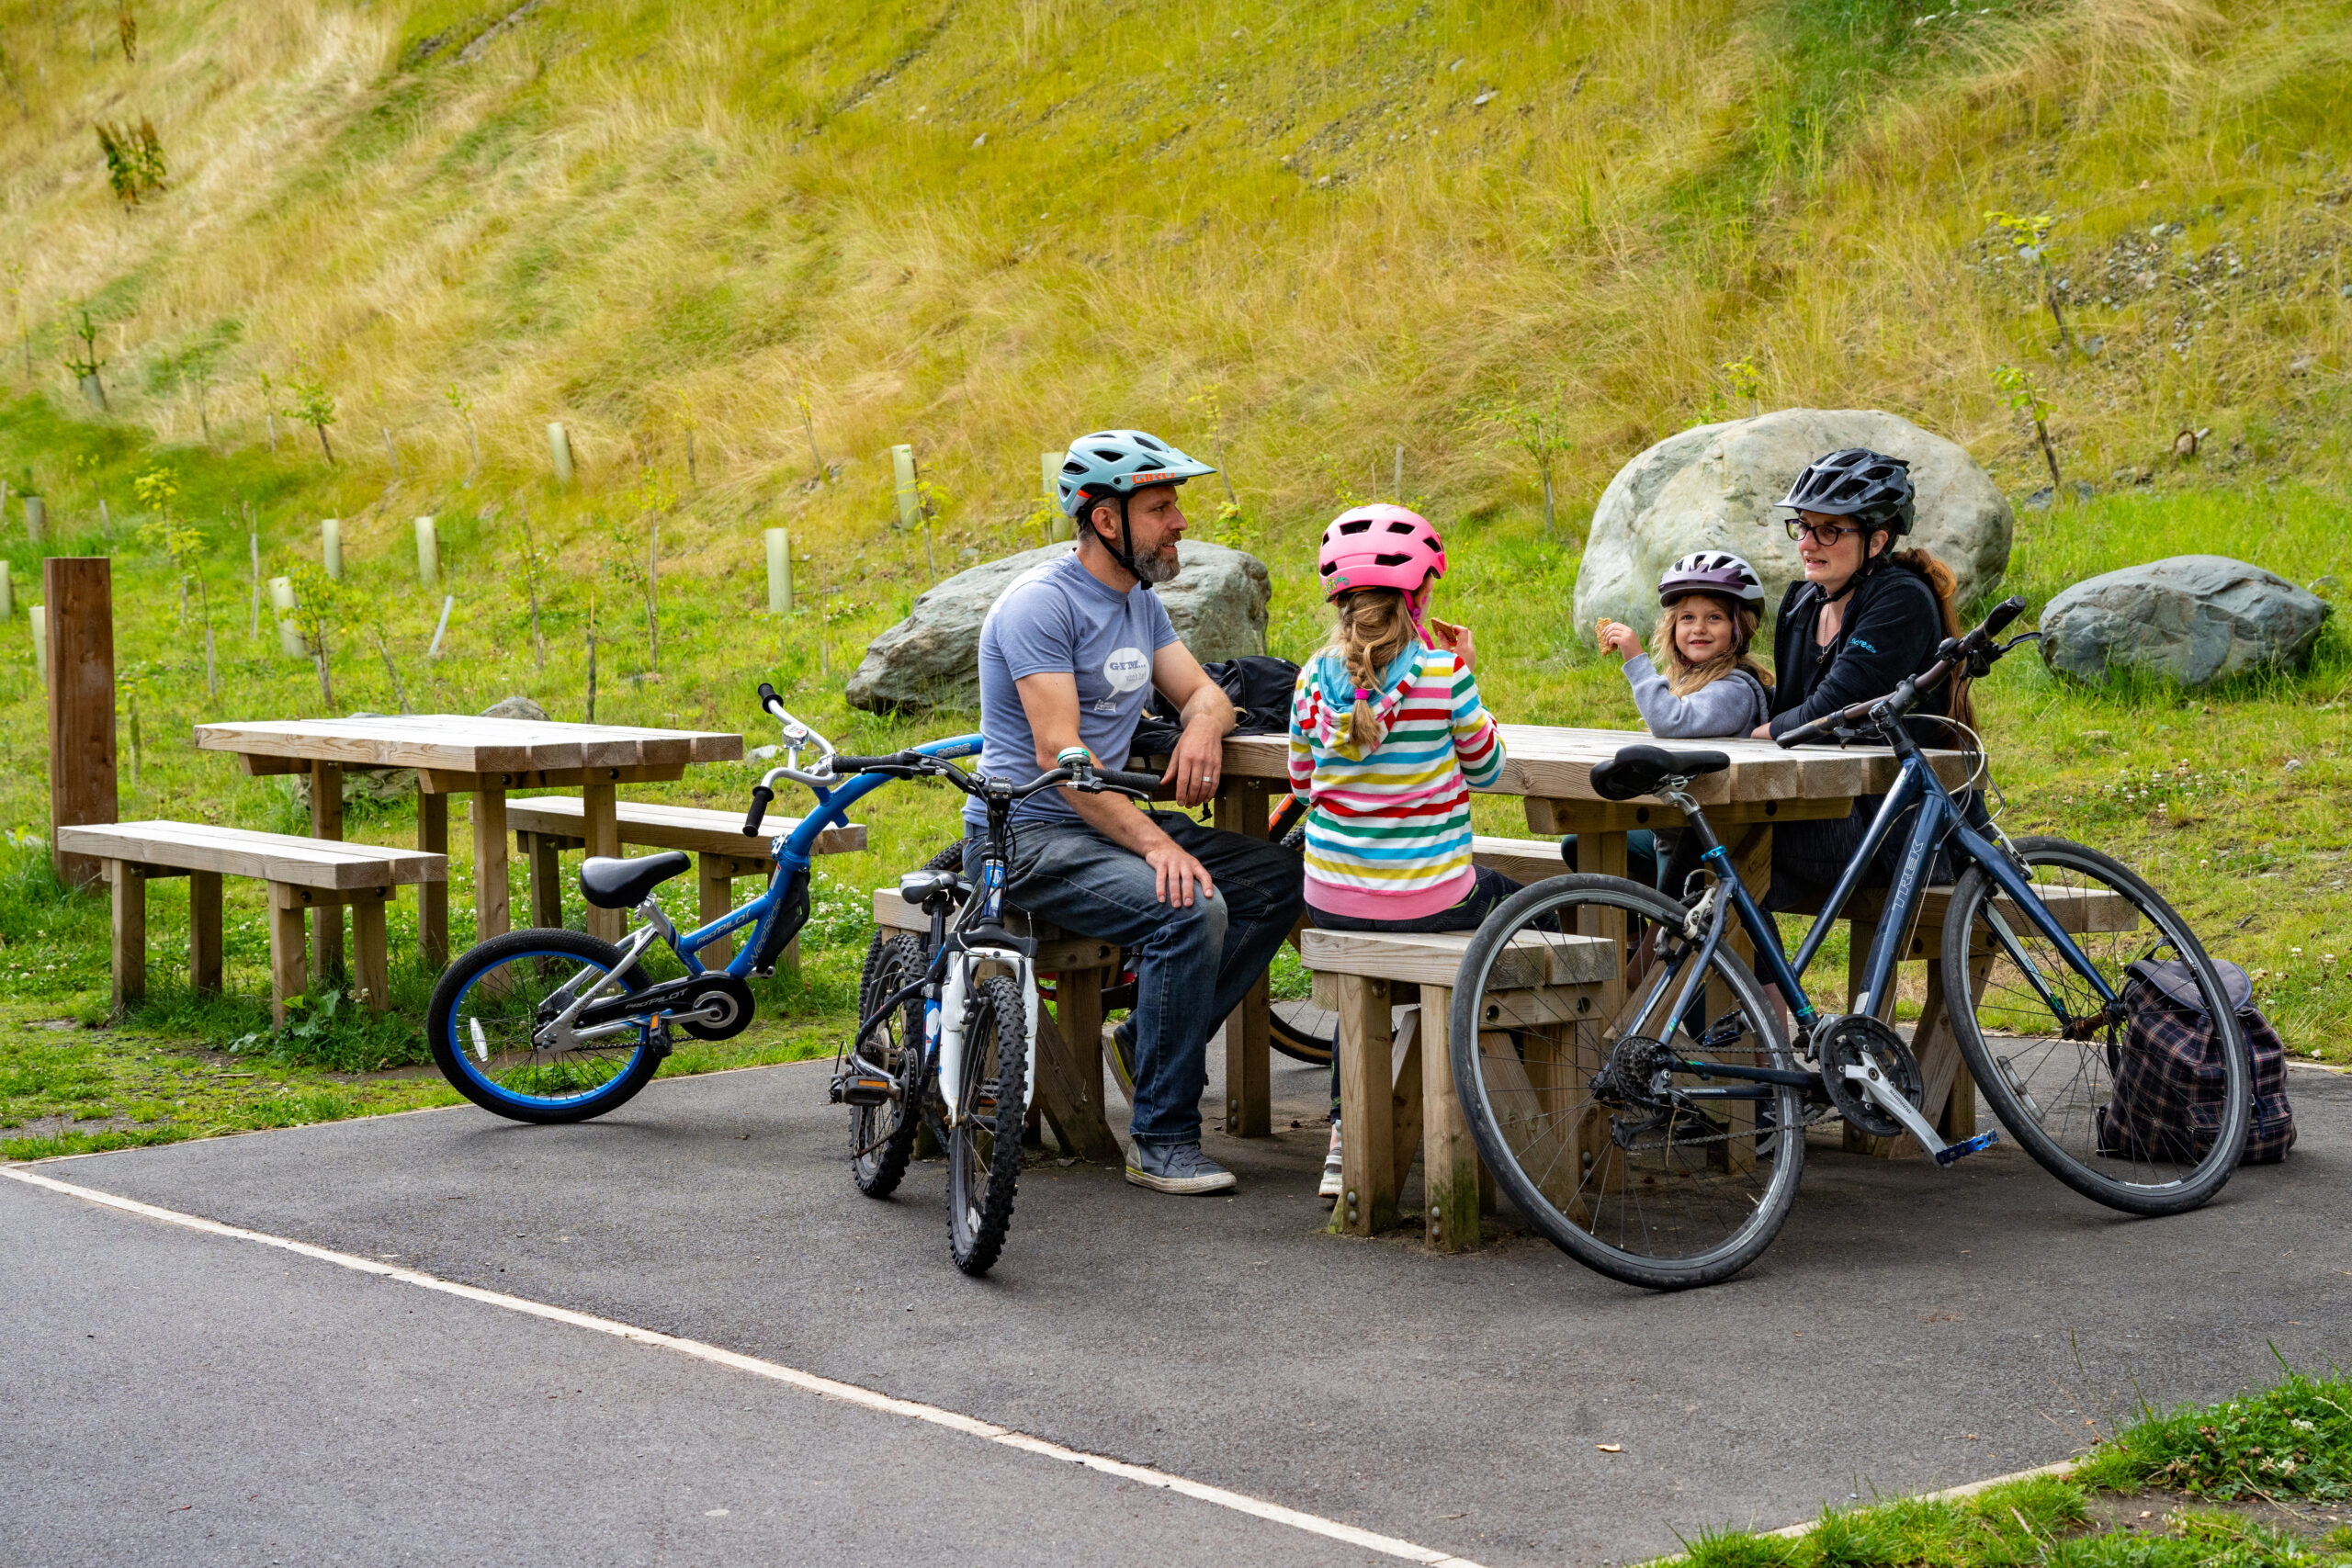
Active travel can play a vital role in improving the health, mobility and social engagement of ageing populations demonstrating the need to foster environments that encourage and facilitate active travel.

Back to top

Population Density

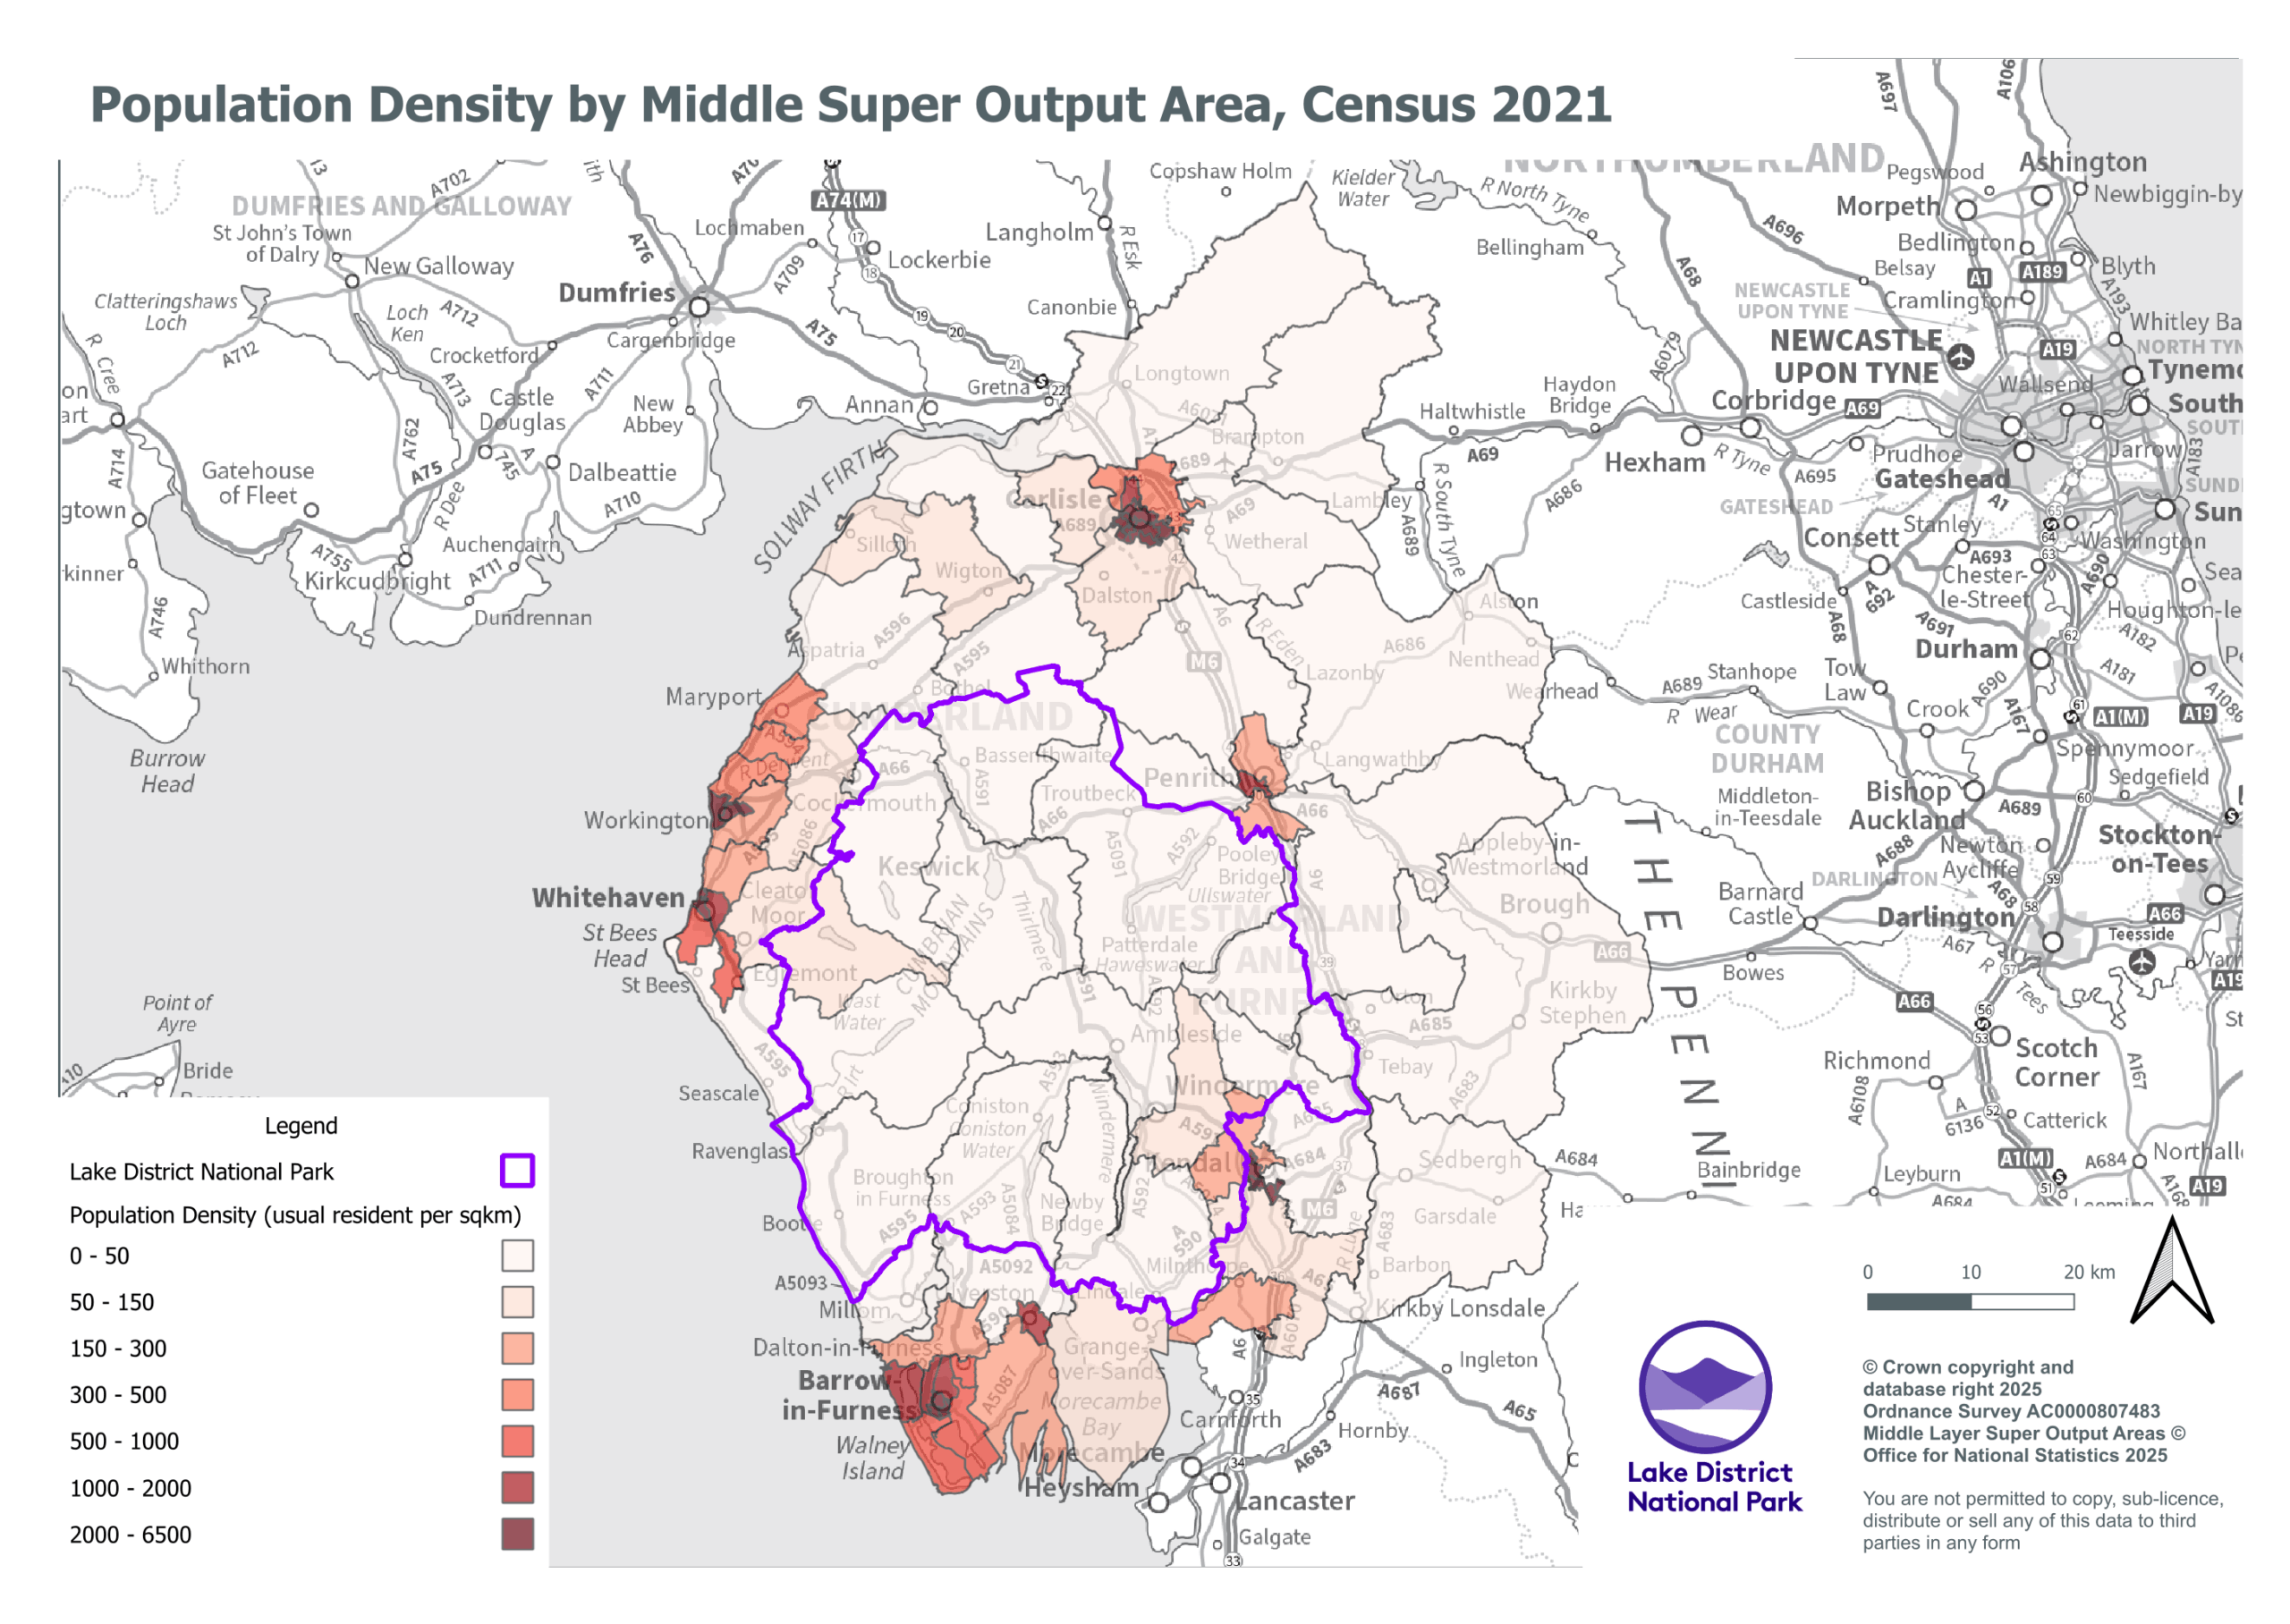
Map 1 illustrates how the population is distributed across the LDNP, providing insight into the potential demand for walking and cycling trips.

Key settlements in the LDNP include Ambleside, Backbarrow/Haverthwaite, Bootle, Bowness and Windermere, Broughton in Furness, Caldbeck, Coniston, Glenridding/Patterdale, Gosforth, Grasmere, Hawkshead, Keswick and Staveley.

These settlements are located across the LDNP and provide a range of services and amenities for local residents and visitors.

The map below shows that the population density in the LDNP is low in comparison to the areas immediately outside of the LDNP, demonstrating the need for this Network Plan to consider and prioritise active travel routes into the LDNP.

Back to top

Map showing population density by middle super output area 2021

Map 1: Population Density by Middle Super Output Area, Census 2021

Indices of Multiple Deprivation

Map 2 illustrates the 2019 indices of multiple deprivation (IMD) – a measure of relative deprivation for small areas or neighbourhoods in England, identified by the Lower Super Output Area (LSOA) census boundaries[1]. The IMD assesses multiple factors such as income, employment, health, education, crime, living environment, and barriers to housing and services. The first decile represents the most deprived areas, and the 10th decile represents the least deprived areas (the most affluent areas). For the purposes of this study, the IMD has been used to determine which areas could benefit the most from improvements in walking and cycling networks.

Figure 4 shows that the LDNP is an area with relatively low levels of deprivation. Larger settlements outside the LDNP experience higher levels of deprivation. Barrow-in-Furness experiences the highest level of deprivation in Cumbria, it falls within the 10% most deprived nationally for overall deprivation. It’s important to note that whilst some areas in the LDNP rank low on the indices of multiple deprivation, pockets of deprivation are found across the National Park. Increased property prices, exacerbated by the prevalence of second homes and holiday rentals and seasonal employment make it challenging for local residents to afford the high costs of living

Back to top


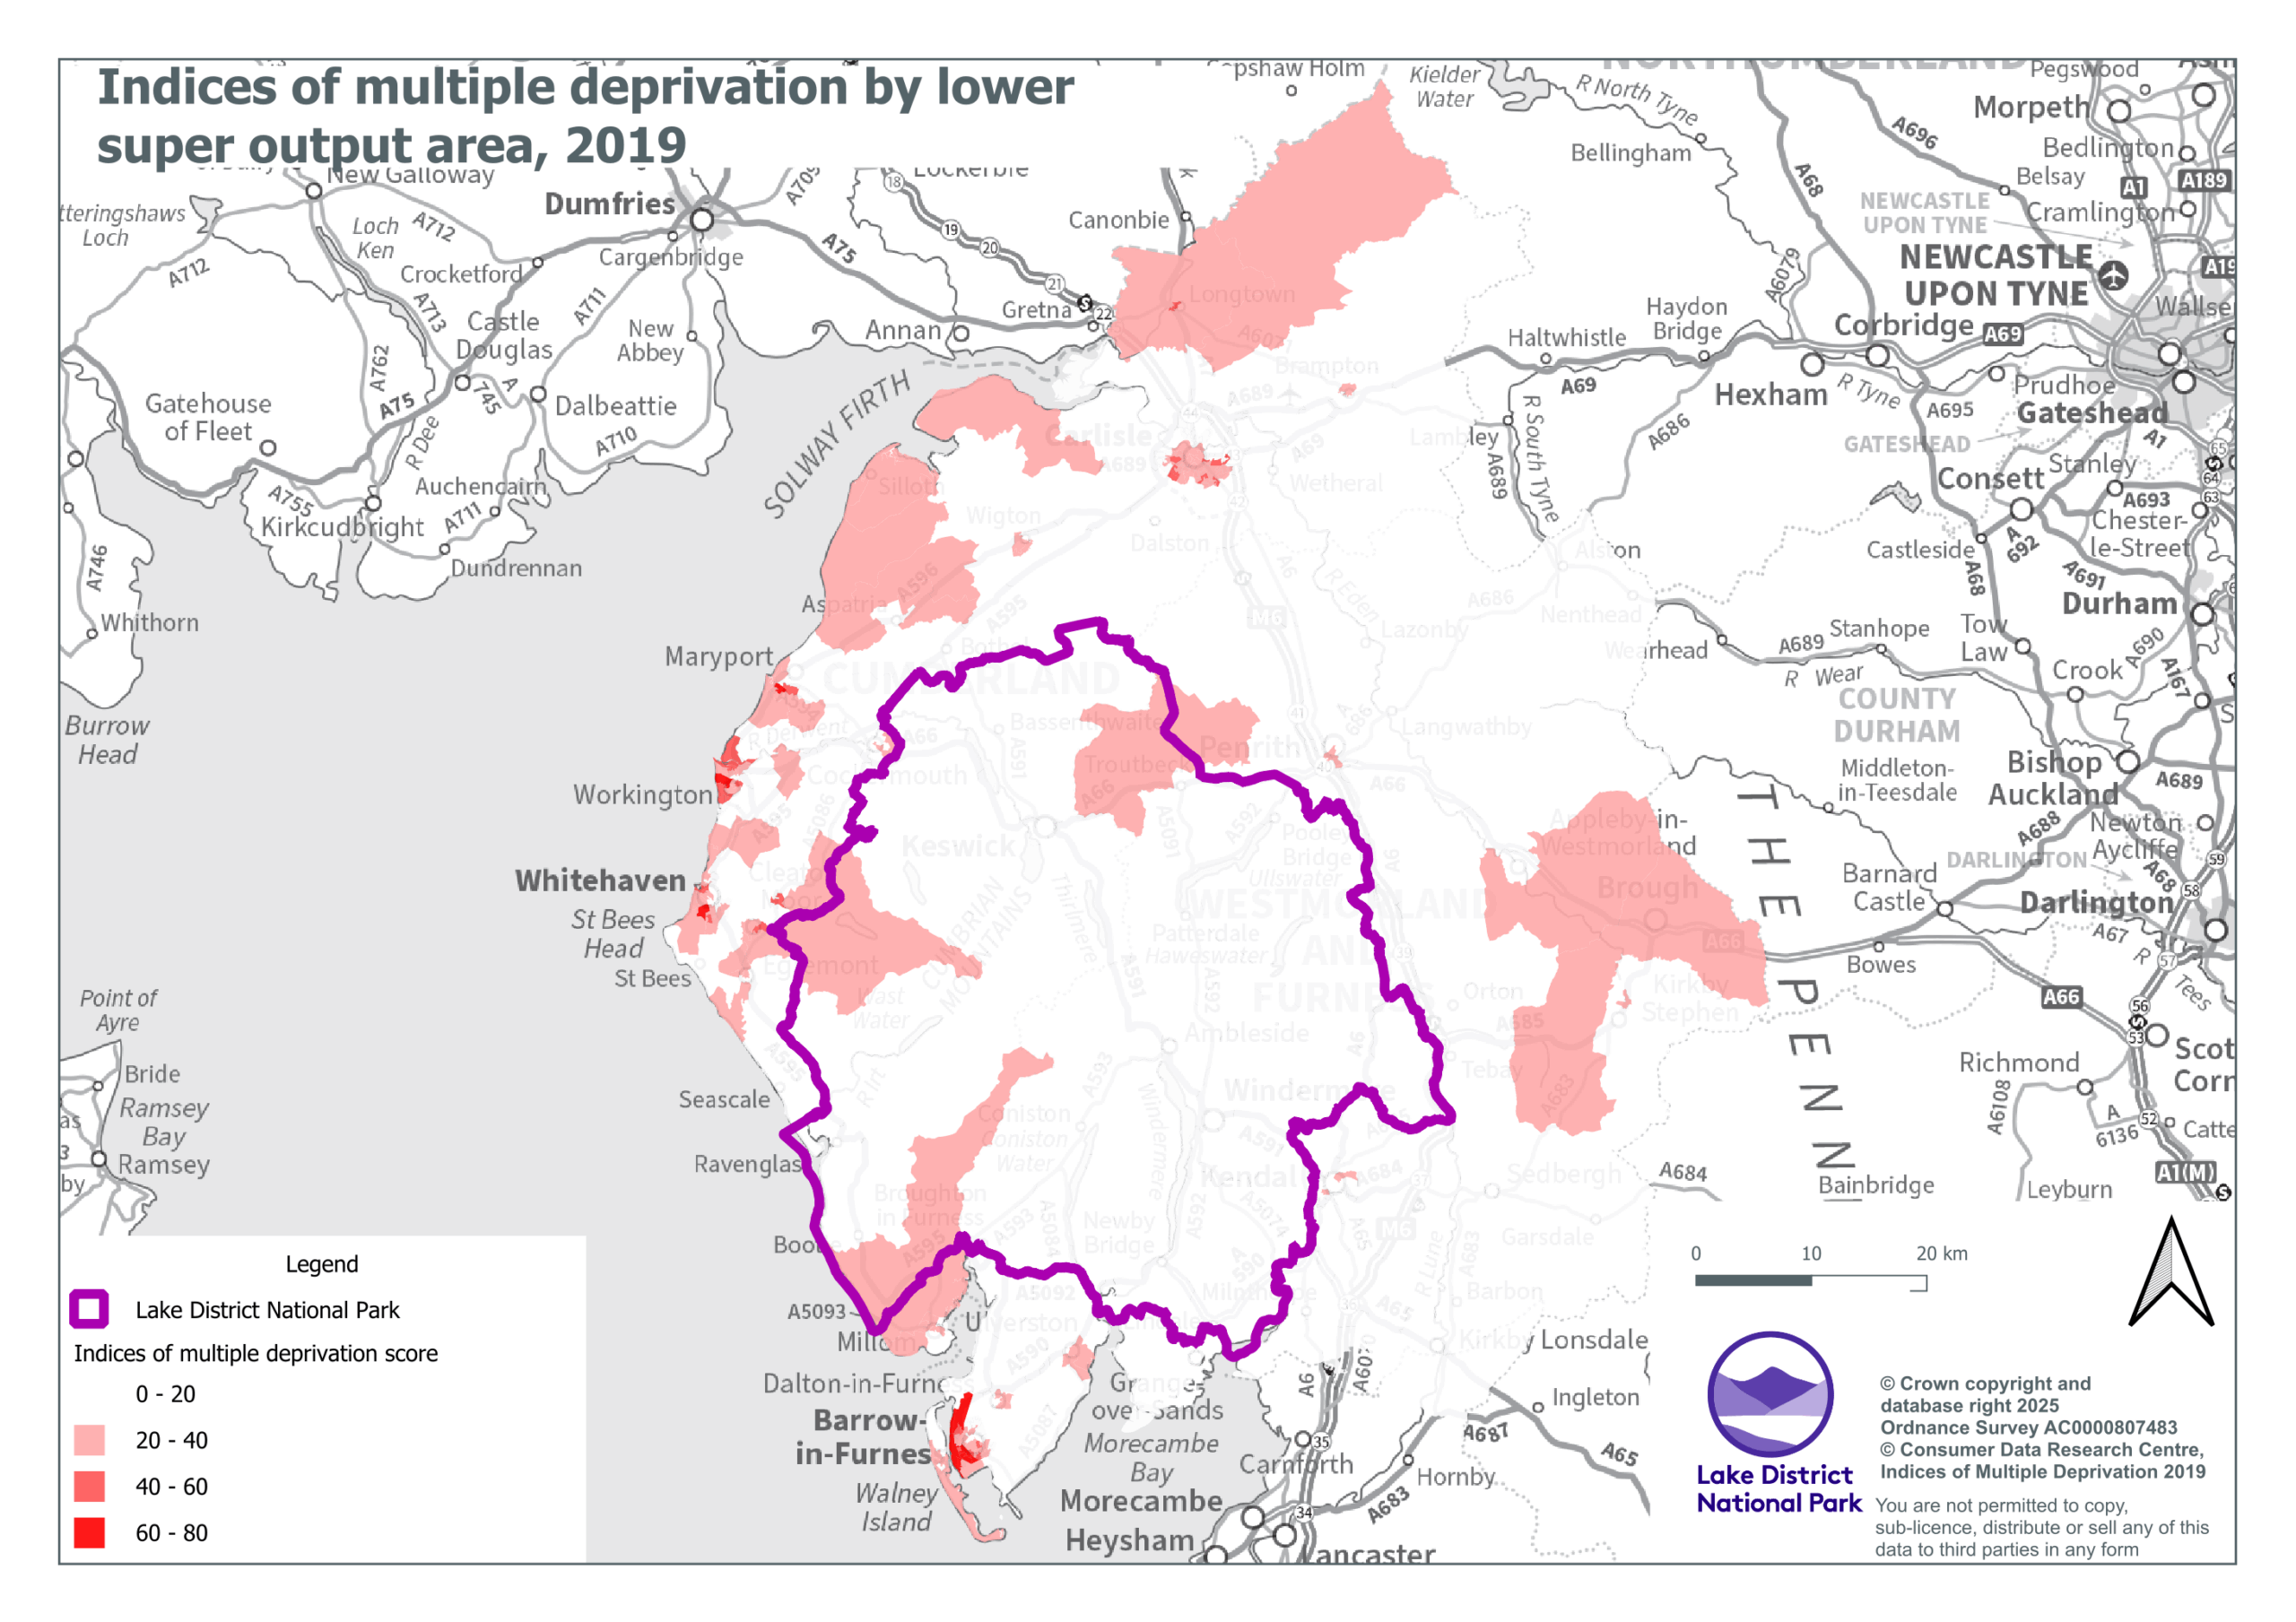
Indices of multiple deprivation by lower super output area, 2019

Map 2: Indices of Multiple Deprivation by Lower Super Output Area, 2019

Health

In the LDNP, 96.7% of residents scored their health as fair, good or very good and as a result are in typically better health than communities outside the border of the LDNP.

Across Cumbria the health of people is more varied. Life expectancy is 9.5 years lower for men and 7.9 years lower for women in the most deprived areas of Cumbria than in the least deprived areas. As an average across Cumbria the life expectancy of men is 79 years and 82.9 years for women which is higher than the average across the Northwest region.

One of the greatest long-term health challenges faced in England is tackling obesity. Across England two-thirds (63%) of adults are above a healthy weight, and of these, half are living with obesity. In the Westmorland and Furness Council area 24.8% of adults are obese, and in the Cumberland Council area 26.2% of adults are obese.

Investing in active travel infrastructure and initiatives can be a powerful tool for improving outcomes in areas experiencing deprivation by encouraging physical activity, reducing the prevalence of chronic diseases, obesity, and diabetes that disproportionately affect deprived areas.

Back to top

Cycling in Langdale

Car Ownership

Across Cumbria car ownership is high. The graph below shows the estimated number of cars or vans available to households in the former local authority areas of Cumbria.

Map showing percentage of car or van ownership by household, Census 2021

Percentage of car or van ownership by household, Census 2021

Map 3 shows the location of households in the LDNP and across Cumbria with no access to a car, providing a snapshot of travel patterns in the region

Generally, more densely populated areas outside the LDNP have a higher proportion of households with no access to a vehicle, highlighting the need for this Network Plan to prioritise active travel routes from urban settlements outside the LDNP.

In areas of lower car ownership, it is noted that there may be a greater reliance on walking, cycling or public transport use for everyday trips.

A map showing households with no access to a vehicle

Map 3: Households with no access to vehicle by Middle Super Output Area, Census 2021

Travel to work

Maps 4 and 5 show the percentage of commuters travelling to work by foot or bicycle based on the 2021 Census.

Of those in employment, driving a private car remains the primary mode of transport to work across the LDNP and Cumbria with an average of 53% of commuters travelling by car to work above the national average of 45.1%.

The percentage of commuters travelling to work by bicycle and on foot varies across the LDNP and Cumbria. As expected, in more rural, less densely populated areas the percentage of commuters travelling by bicycle or on foot is extremely low.

In larger settlements the number of commuters travelling by bicycle and foot is higher than the national average, including in the LDNP. Map 4 shows that 20-25% of commuters in the settlements of Keswick, Ambleside and Windermere travel to work by foot. Generally, the location of commuters using active travel to get to work corresponds to the location of households with no access to a vehicle.

Back to top

  • Map showing percentage of residents travelling by foot to workplace by Middle Super Output Area, Census 2021

    Map 4: Percentage of residents travelling by foot to workplace by Middle Super Output Area, Census 2021

  • Map showing percentage of residents travelling by bicycle to workplace by Middle Super Output Area, Census 2021

    Map 5: Percentage of residents travelling by bicycle to workplace by Middle Super Output Area, Census 2021

Propensity to Cycle

The Propensity to Cycle (PTC) is a Department for Transport-funded tool that uses information about the length of resident trips and hilliness to identify trips that might be most easily switched to cycling. The PCT uses data from the 2011 Census and provides a range of scenarios to explore cycling potential at an area or route levels.

Propensity to Cycle based on the 2011 Census shows that an average of 3% of people cycle to work, shown in Map 6. The government target scenario assumes cycling doubles nationally in line with 2025 targets. Across Cumbria the government target scenario is 5%, shown in Map 7.

The more ambitious Go Dutch scenario, shown in Map 8, uses Dutch cycling propensities, based on trip distance and hilliness. In other words, if Cumbria was a Dutch town, based on how far people are travelling and how uphill it is, what would cycling levels be? In the Go Dutch scenario, Cumbria would see 18% of people cycling to work.

The Ebikes scenario, Map 9, builds on the Go Dutch scenario and looks at the additional cycling potential if people had Dutch propensity to cycle and widespread access to electric bikes. This scenario would see 25% of people travelling to work by bike.

The PTC scenarios enable us to identify priority areas for investment to facilitate increase travel to work by bike. Map 8 and 9 demonstrate that generally the propensity to cycle increases in urban areas outside the LDNP. Importantly, the heart of the lakes corridor is highlighted in Map 9 as an area where with real behaviour change in the way people get to work and investment in cycling infrastructure could facilitate higher numbers of people cycling to work.

Back to top

  • A map showing the Propensity to Cycle Tool Census 2011

    Map 6: Percentage cycling to work, Propensity to Cycle Tool, Census 2011

  • A map showing the Propensity to Cycle Tool Government Target

    Map 7: Government target, percentage cycling to work, Propensity to Cycle Tool

  • Propensity to Cycle Tool Go Dutch

    Map 8: Go Dutch, percentage cycling to work, Propensity to Cycle Tool

  • A map showing the Propensity to Cycle Tool E-Bikes

    Map 9: E-Bikes scenario. Percentage cycling to work, Propensity to Cycle Tool

Cumbria Visitor Survey

Approximately 18.14 million tourists visit the LDNP per year. Across the wider area of Cumbria in 2022, the majority, 65% of tourists arrive by non-electric car. An additional 11% arrive by motorhome, 9% in electric or hybrid vehicles and 7% by motorbike. In total 91% of tourists arrived by private vehicle in 2023, up from 86% in 2018 and 81% in 2015.

Once visitors have arrived in Cumbria, 63% travel by petrol car and 57% travel on foot, reflecting the findings of the survey that found that one of the most popular activities for tourists was a short walk.

The Cumbria Visitor Survey shows results from people who visited in 2024 and completed the online survey. It does not provide an accurate representation of all visitors but offers a snapshot into visitor preferences and behaviours. The survey provides an insight into the most visited areas of the LDNP and Cumbria.

The most popular areas visited were Keswick and Ambleside, attracting nearly half of all respondents respectively. Next most popular were Windermere (35%), Grasmere (34%) and Bowness (33%).

Back to top

  • Cycling near Coniston Boating Centre

    Cycling near Coniston Boating Centre

  • Wheelchair users on the Dalegarth to St Catherine’s Miles Without Stiles route

    Wheelchair users on the Dalegarth to St Catherine’s Miles Without Stiles route

  • Cyclists at Holbeck Ghyll Country House

    Cyclists at Holbeck Ghyll Country House

Appetite to Travel Differently

The ‘Where do you want to get to?’ report 2023 found that in the LDNP traffic is perceived to be the main problem with the current transport system. Unreliable public transport and parking were also flagged as problems.

The report concludes that there is an overwhelming appetite for change. People want better and more extensive integrated public transport, and the ability to use active travel enabled by reductions in traffic. Positively, there is little appetite for car-focussed solutions.

Back to top

  • Family cycling on the Keswick to Threlkeld Trail

    Family cycling on the Keswick to Threlkeld Trail

  • A wheelchair user on the Grasmere Jubilee Miles Without Stiles route

    A wheelchair user on the Grasmere Jubilee Miles Without Stiles route

Strava Metro Data

Map 10 and Map 11 show heatmaps of walking, running and cycling trips across the LDNP using Strava Metro data.

Generally, the most used routes in the LDNP are in the towns of Keswick, Ambleside and Windermere. Additionally, Map 10 shows how cyclists are travelling between the larger service centres both into and within the LDNP.

Strava Metro data in Map 10 and Map 11 helps determine route popularity and where to focus infrastructure improvements.

Back to top

  • Run, walk and hike trip heatmap, Strava Metro 2024

    Map 10: Run, walk and hike trip heatmap, Strava Metro 2024

  • Cycling trip heatmap, Strava Metro 2024

    Map 11: Cycling trip heatmap, Strava Metro 2024

Existing Active Travel Routes

Map 12 and Map 13 show existing walking and cycling routes across the LDNP. Map 12 shows Named Trails and Miles Without Stiles Routes. Miles without stiles routes are more accessible routes suitable for people with limited mobility. The routes are graded based on gradients and surface conditions. Named Trails include the Ullswater Way and Eskdale Trail.

Map 13 shows the National Cycle Network. Gaps have been identified in the National Cycle Network and this Network Plan outlines how and where these gaps will be closed. Sustrans plans to upgrade the National Cycle Network can be viewed here.

Back to top

  • Map showing Miles without Stiles and Named Trails

    Map 12: Miles without Stiles and Named Trails

  • Map showing Sustrans National Cycle Network

    Map 13: Sustrans National Cycle Network

  • Wheelchair user on the Keswick to Threlkeld Trail

    Wheelchair user on the Keswick to Threlkeld Trail

  • People walking on the West Windermere Way

    People walking on the West Windermere Way

Public Transport

Map 14 shows the bus network across the LDNP. The bus network connects the main service centres in the LDNP. The 555-bus service runs between Lancaster, Kendal, Windermere, Ambleside and Keswick and is one of the most popular bus services through the LDNP and runs every half an hour.

Back to top

  • Map showing Cumbria Bus Routes

    Map 14: Cumbria Bus Routes

Walker in the central Lake District

Next Section: Developing the Network Plan

This section summarises how information gathered through the background data analysis, public engagement and stakeholder consultation has been used to develop the Network Plan for the LDNP.

Cyclists on the Keswick to Threlkeld trail

Back to the Active Travel Network Plan

The Plan outlines new walking, cycling and wheeling routes and priority areas for improvement to achieve the objectives of promoting active travel and creating safe, accessible and sustainable infrastructure for pedestrians, cyclists, wheelchair users and horse riders.