Download the LDNP carbon budget progress 2019 report as PDF
Prepared by: Gwen Harrison, Small World Consulting Ltd
Checked by: Mike Berners-Lee
Date published: 28 February, 2020
The Lake District National Park Partnership is committed to leading the way on climate change, and was one of the first local areas to set itself a carbon budget, as part of its Low-carbon Lake District initiative. A carbon footprint analysis was initially carried out in 2010, and this was used as a baseline against which to measure progress against a target of an additional 1% reduction per year from local actions, i.e. 7% reduction by 2017 compared to the baseline. Each year, Small World Consulting has undertaken an audit of projects which aim to reduce carbon within the National Park, to assess carbon savings. Between 2010 and 2017 the cumulative carbon savings, due to actions taken by partners, were 343,000tCO2e. In 2017 savings from local actions were estimated to be 4.1% of baseline emissions, against the 7% target.
Things have changed a lot since 2010, so in 2017 it was agreed that weshould calculate a newbaseline, using a new methodology, against which to measure progress from 2017 onwards. The Re-baseline report, together with the methodology for 2017 is here. The total Re-baseline emissions are 3,137,000tCO2e. As before, we aim to reduce the emission of carbon dioxide and other greenhouse gases, measured on a consumption basis, by 1% per year. This report covers the period April 2018 to March 2019, although, as discussed in the chapters below, the reporting period for some actions is different.
Until 2017, the annual carbon budget updates were calculated using a ‘bottom-up’ approach -listing actions taken by Partners and assessing their impact. This had the benefit of highlighting the impact of local actions but has proved laborious. The Partnership agreed that from 2017 we would use a ‘top-down’ approach in some areas, using national datasets to monitor annual changes in the following areas, which together account for a significant proportion of the total footprint:
For these two areas we continue to use the Defra emission factor (EF) for the Re-baseline year. This is to ensure that we do not include in our calculations the impacts of decarbonisation (or otherwise) of the national fuel mix from year to year, and instead capture only the emissions changes associated with actual changes in behaviour locally.
We also continue quantifying local actions where data are readily available and where the impacts are thought to be significant(e.g. in the case of renewable energy installations, positive changes in land management and public sector actions to reduce emissions).From 2018onwards, however, where quantitative data are not readily available we have focused on narrative descriptions. We have also developed case studies, in the form of slides, highlighting some of the positive actions that have been taken over the last year.
We used traffic flow data from 14 sites within the Lake District National Park that are monitored by Cumbria County Council as the basis for calculating changes in travel emissions between 2017and 2018 (i.e. the reporting years 2017/2018 and 2018/2019, respectively – transport data are provided by calendar year rather than accounting year). The calculations include only non-HGVs in an attempt to capture only the travel undertaken by visitors and residents, rather than industry.
Total average daily vehicle movements (excluding HGVs) for each month, for each travel point, were calculated for both 2017and2018. We used the difference between the two years as a ratio which, applied to 2017‘vehicle fuel and car’ emissions, allowed us to extrapolate 2018 ‘vehicle fuel and car’ emissions, and therefore calculate the change in emissions between 2017and 2018.
Note that where data were missing for any month in either year, we removed the data for both years in order not to skew the results by differences in traffic flow for different months (for example, if one travel point had data missing for July and August 2017, we also removed the data for July and August 2018).
We calculated home energy emissions using the same methodology as we used for the 2017 Re-baseline; electricity and domestic fuel consumption data were taken from the ONS, broken down by Middle Super Output Areas (MSOA), and the population data were taken from the 2011 census, adjusted for the LDNP. Defra doesn’t release electricity and domestic fuel consumption data until the following winter, so the data used for the Re-baseline were from 2015 (Jan-Dec), not 2016. Equally, the data used for this update are from 2017, not 2018.
Note that since the 2017Re-baseline was calculated, Defra has retrospectively adjusted the 2015 data. In our update calculations we have therefore used the adjusted (actual) figures as the baseline against which to calculate change.
The Lake District National Park Authority provided the total figure for emissions reductions associated with renewable energy installations and positive land management actions.
Emissions savings from the public sector include operational savings from the LDNPA and SLDC (scaled down proportionately for the LDNP area/population) and waste reduction measures (i.e. avoidance of landfill through recycling and diverting waste to the Waste to energy plant) implemented by the six District Councils across Cumbria. Again, these figures were provided by the respective organisations.
The total emissionshave increased by -2,040tCO2e during the 2018/2019reporting period, as shown in Figure1, below.This is in contrast to the 1% reduction target. Part of this increase may be explained by an increase in tourist numbers –see Section 4.1 below.
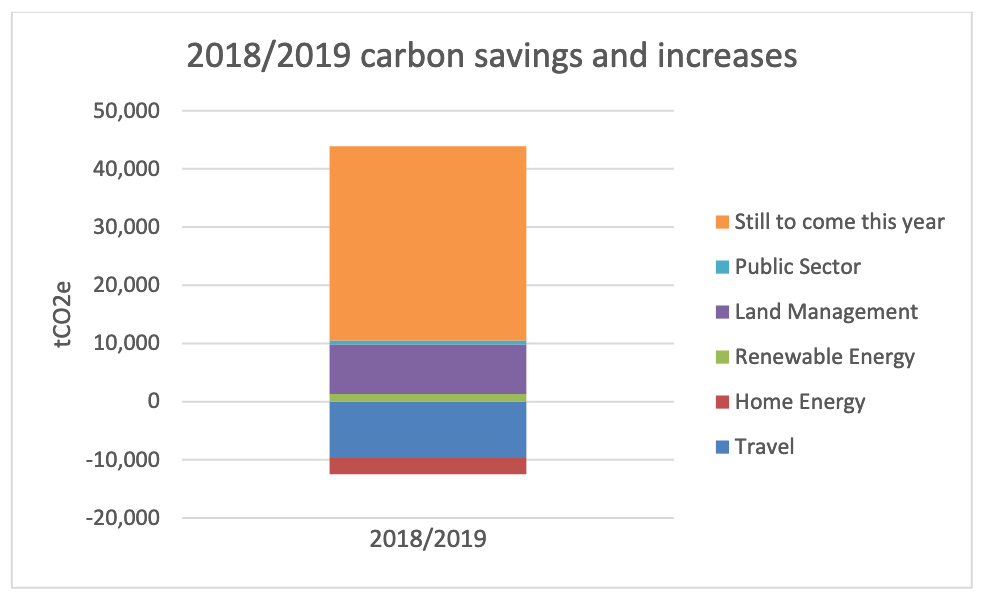
Figure 1: 2017/2018 carbon savings and increases
Transport emissions have increasedin 2018 compared with 2017 by 9,691tCO2e. This appears to be against the national trend; according to the National Travel Survey, there has been a very slight reductionin the average car miles travelled per person, from 5104 in 2017 to 5036 in 2018. There are several possible reasons for the increase in road transport within the LDNP, including:
Home energy emissions have increasedbetween 2016 and 2017 by 2,829tCO2e. This includes an increase inemissions from both gas and electricity consumption (1,596tCO2e and 1,233tCO2e, respectively). These figures go against national trends, which showed an overall fall in energy consumption (both gas and electricity, and both total and per household) across the UK between 2016 and 2017
According to the baseline calculations, less than 1% of home energy emissions were attributable to visitors within the national park. As such, we haven’t calculated the extent to which the increase in emissions from home energy can be attributable to an increase in visitor numbers, as we did for transport emissions, because the figure will be negligible.
Cumbria Action for Sustainability (CAfS), one of the LDNP Partners, has carried out a number of initiatives to reduce home energy use across Cumbria. These are highlighted as a Case Study inAppendix 1, and include the following:
Emissions savings from renewable energy are 1,283tCO2e.
Actions taken across the park in relation to renewable energy include, among others:
It should be noted that although there have been emissions savings due to new installations, the amount of savings has gone down compared with previous years, presumably at least in part because of the withdrawal of the Feed-in-Tariff – the government subsidy given for renewable electricity generation. In addition, there was a spike in renewables in 2016/2017 due to a large number of hydropower initiatives that had been in the planning system for some time, and which came into operation during this period.
Land management actions account for 8,530tCO2e of savings and are broken down as follows:
Note that there have been large savings from peatland restoration due, in part, to work being carried out on degraded peats. The impact of restoring these is relatively higher than restoration work on less severely degraded peats.
Emissions savings from the Public Sector are 665tCO2e. This is broken down as follows:
We have not quantified carbon emissions savings from this sector because the data aren’t readily available.
No initiatives have been reported on this year for re-use, recycling and repair.
No other initiatives have been reported on this year.
Figure 1 above shows that the 1% emissions reduction target of 31,367tCO2e for 2018/2019has not been met, and in fact there has been an increase in emissions from the factors that have been assessed. The increase in emissions for this period is-2,040tCO2e.
We estimate that annual emissions in the LDNP are 4.1% lower as a result of local actions since 2010. This compares to a target of 9% annual reduction.
Figure 2 shows cumulative progress against the target, and includes previous years’ savings (i.e. those made before the 2017 Re-baseline) as a percentage of the target. Note that the dip in cumulative emissions savings in 2017/18 was due to the change in methodology and the recalculation of the baseline rather than an actual drop in cumulative emissions that year. However, the 2018/19 dip does reflect the increase in emissions seen this year.
The blue line shows the target of 1% savings per year, rising to 9% in 2018/2019. The red line shows the actual cumulative annual savings (or increases), with the dotted section as a projection for future years.
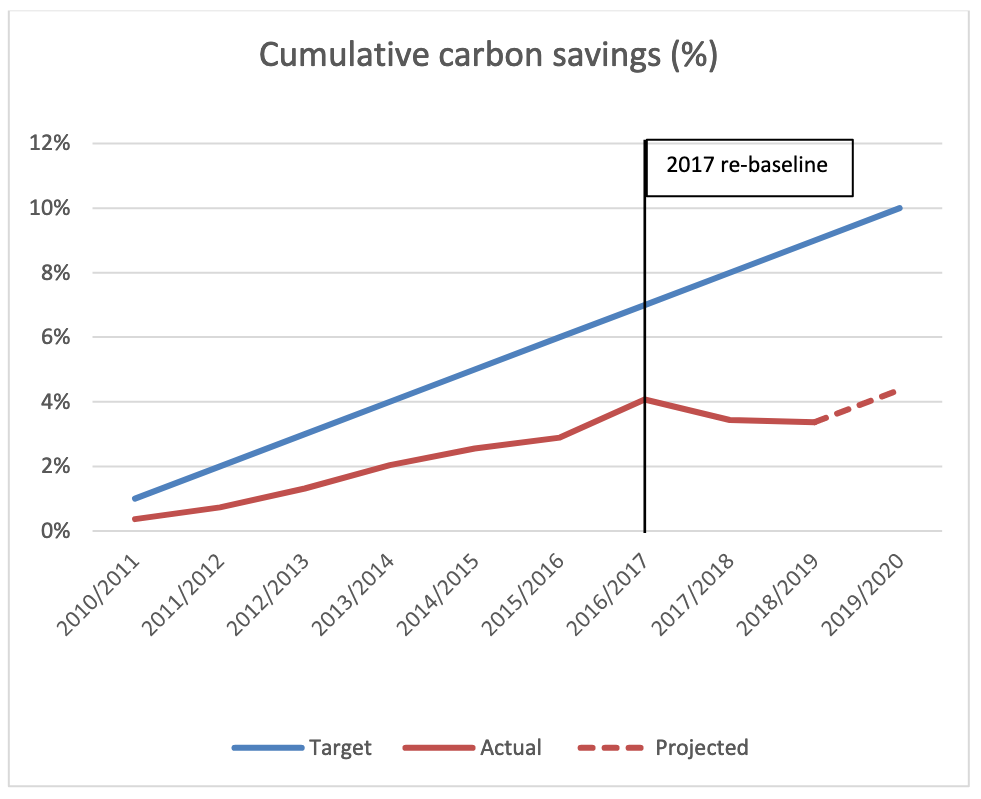
Figure 2: Cumulative carbon savings (as a percentage of the baseline), including those made before the 2017 Re-baseline